
Custom Dashboards.
The right view for every role, from the shop floor to the boardroom.
Every role, its own view.
Custom Dashboards are built around the questions each team asks: where things are, what has moved, what is missing and what needs action today.
Managers see trends across sites, supervisors see live exceptions and auditors see complete histories, all from the same data.
- Role-based views
- Live KPIs
- Location views
- Reports and exports
Works with
What it does.
Role-based views
Give each role a dashboard with the measures it needs.
Live KPIs
Counts, locations, utilisation and exceptions, updated as events arrive.
Location views
See items by site, building, room or zone.
Reports and exports
Schedule reports and export data for audits and finance.
Drill-down
Go from a summary figure to the individual item in a click.
Multi-site
Compare performance across sites and countries.
Three simple steps.
Choose measures
Pick the KPIs and filters for each role.
Arrange
Lay out charts, tables and location views.
Share
Publish by role, or schedule as reports.
Questions, answered.
Can each department have its own dashboard?
Yes. Dashboards are set per role, so each team sees the measures and sites that matter to it.
Can we export the data?
Yes. Reports can be exported and scheduled for audits, finance and management reviews.
Do dashboards update in real time?
They update as events reach the platform, so counts and locations stay current.
You may also like.

AI Module
Predictions, anomaly detection and recommendations built on your own tracking data.
Read more
Mobile App
Scanning, offline work and alerts in the field, on phones, tablets and RFID handhelds.
Read more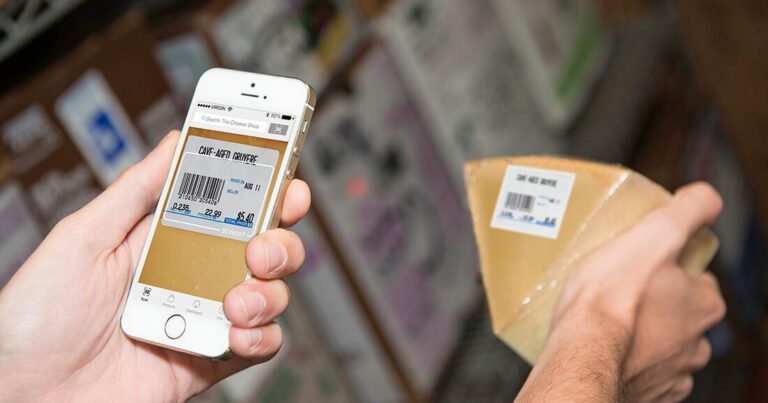
Organisational Asset Management
IT equipment, furniture, fixed assets, tools and vehicles in one live register.
Read moreSee it on your own assets.
Book a 15-minute tracking assessment. We will map your assets and suggest the simplest setup to start with.